Markets Risk-on After Positive U.S. debt Ceiling Deal Boosted The Dollar
The US Dollar continued its impressive rally, buoyed by the optimistic prospects of a tentative debt ceiling deal between President Joe Biden and top Republican Kevin McCarthy. The deal aims to avert a potentially catastrophic default, boosting investor sentiment. Concurrently, the US equity market experienced a surge, driven by risk-on sentiment and gains in chip stocks, particularly Nvidia Corp, whose stock soared to record highs. In other markets, oil prices climbed as US officials appeared close to a debt-ceiling agreement, while a decline in US oil rigs contributed to positive sentiment. Gold prices faced downward pressure as the US Dollar gained strength. The USD/JPY currency pair continued its bullish run, driven by a widening US-Japan yield spread after the release of upbeat inflation reports from the US region.
Current rate hike bets on 14th June Fed interest rate decision:
Source: CME Fedwatch Tool
0 bps (31%) VS 25 bps (69%)
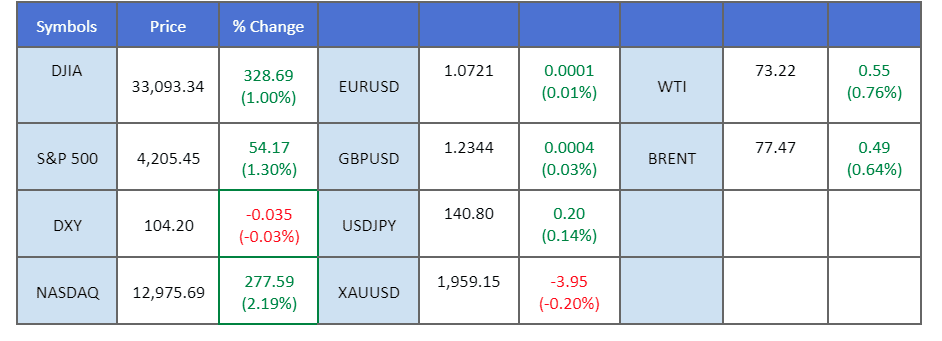
Market Overview
Prices as of 03:00 EET
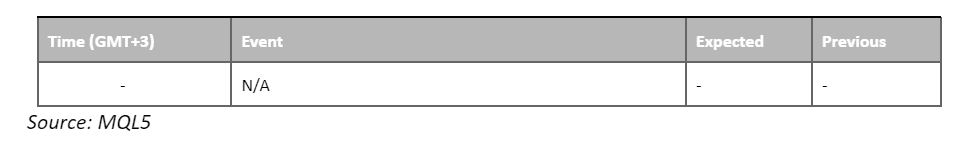
Economic Calendar
Market Movements
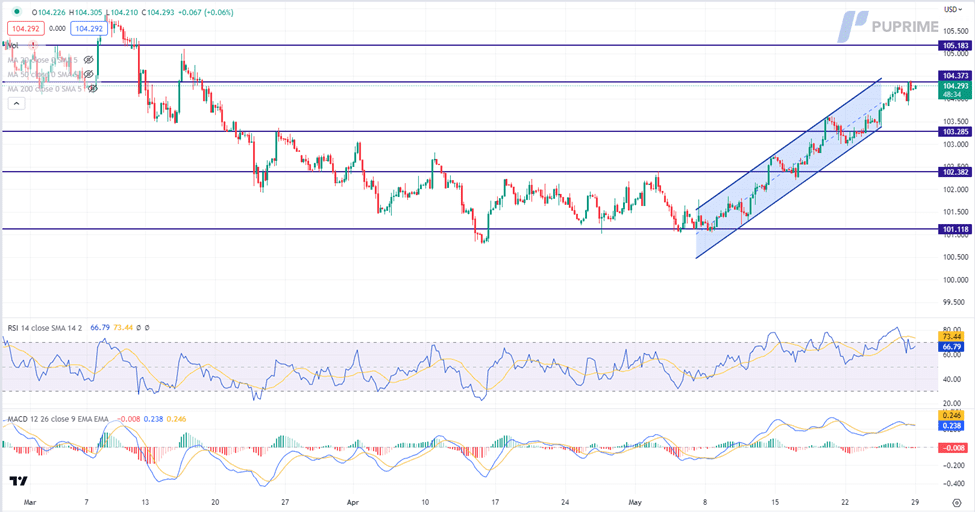
DOLLAR_INDX, H4
The US Dollar continues gaining ground, riding on a wave of bullish momentum as investors responded positively to news of a tentative deal between Democratic President Joe Biden and top congressional Republican Kevin McCarthy. This deal aims to raise the US debt ceiling, effectively averting a potential default scenario that had the potential to send shockwaves through the global economy. However, while this development brings some respite, passing the deal through the narrowly divided Congress remains challenging.
The Dollar Index is trading higher while currently testing the resistance level. However, MACD has illustrated increasing bearish momentum, while RSI is at 67, suggesting the index might be traded lower as technical correction since the RSI retreated sharply from the overbought territory.
Resistance level: 104.40, 105.20
Support level: 103.30, 102.40
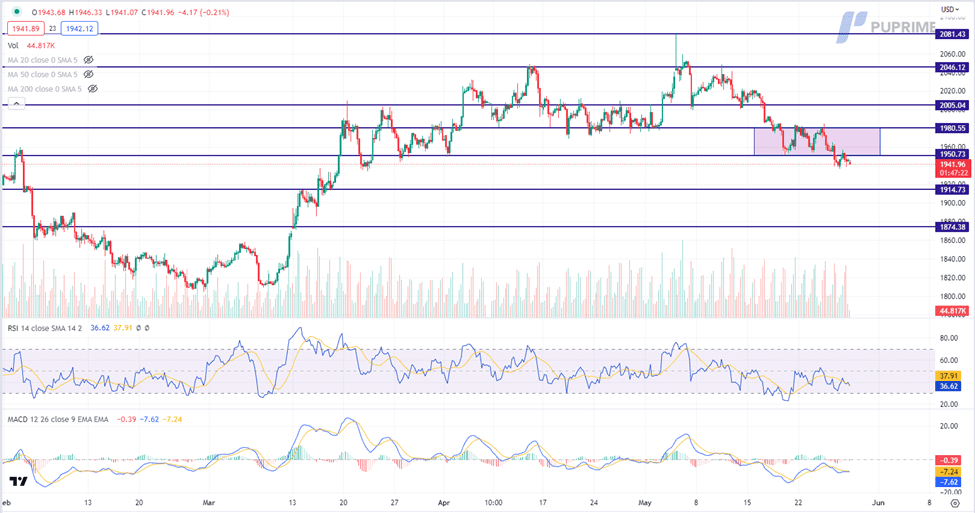
XAU/USD, H4
Gold prices experienced a slight decline as the US Dollar strengthened, driven by investors’ growing optimism surrounding the debt ceiling deal. This positive sentiment has prompted a shift in investor preferences towards riskier assets, dampening the demand for safe-haven metal. However, despite this overall trend, volatilities persisted throughout the week, underscoring the need for investors to closely monitor updates on the progress of the US debt ceiling talks. Additionally, market participants should remain attentive to a series of crucial economic data releases from the US region, which could provide further trading signals and influence gold prices in the coming days.
Gold prices are trading lower following the prior breakout below the previous support level. MACD has illustrated increasing bearish momentum, while RSI is at 37, suggesting the commodity might extend its losses as the RSI stays below the midline.
Resistance level: 1950.00, 1980.00
Support level: 1915.00, 1875.00
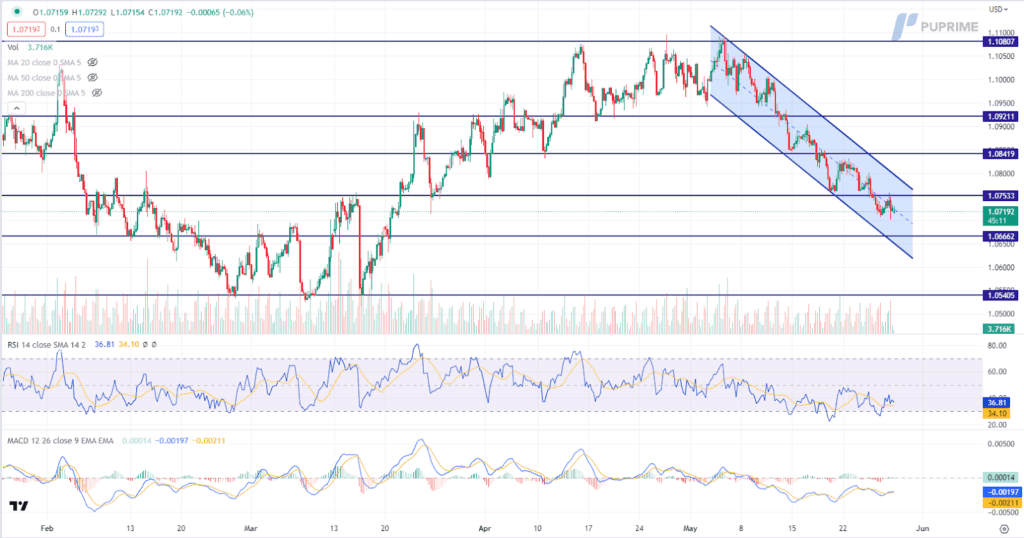
EUR/USD,H4
The EUR/USD pair experienced a decline yesterday as the German economy, the largest in Europe, slipped into a recession in the first quarter with a 0.3% decrease in GDP. This news weighed on the euro and caused it to weaken against the U.S. dollar. Additionally, the dollar received an additional boost from the optimistic outlook regarding the debt ceiling. These combined factors led to the euro’s drop against the dollar in yesterday’s trading session.
The euro is trading lower following the prior breakout below the previous support level. However, MACD has illustrated increasing bullish momentum, while RSI is at 37, suggesting the pair might trade higher as technical correction since the RSI rebounded from its oversold territory.
Resistance level: 1.0755, 1.0840
Support level: 1.0665, 1.0540
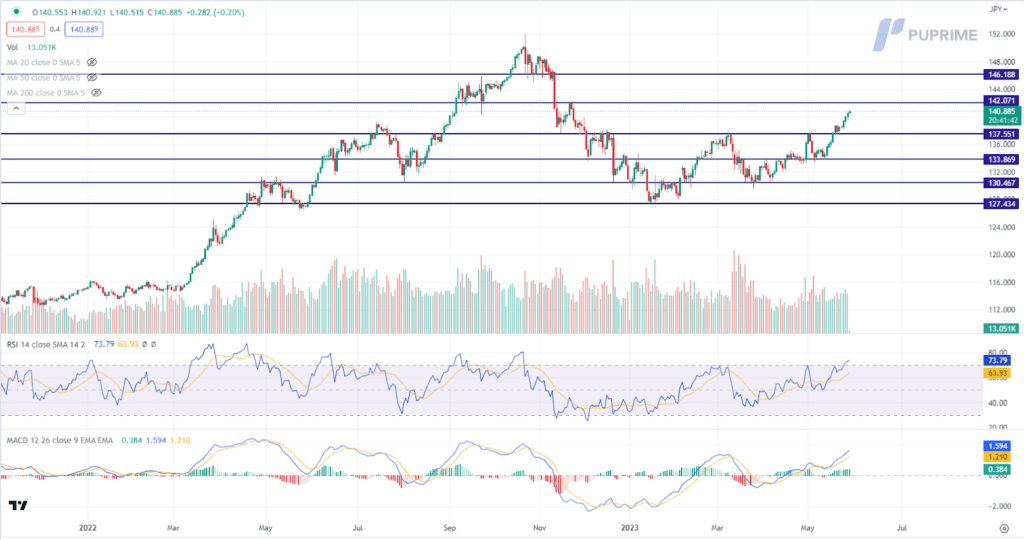
USDJPY,H4
The USD/JPY currency pair remains firmly in a bullish trajectory, propelled by the widening spread between the government bond yields of the United States and Japan. The divergence in yields has been a key driver for the appreciation of the US Dollar against the Japanese Yen. Adding to the bullish sentiment, a recent positive inflation report from the US has further reinforced expectations of potential rate hikes by the Federal Reserve. The Bureau of Economic Analysis reported that the US Core Personal Consumption Expenditures (PCE) Price Index increased from the previous reading of 0.30% to 0.40%, surpassing market expectations of 0.30%.
USD/JPY is trading higher while currently testing the resistance level. MACD has illustrated increasing bullish momentum. However, RSI is at 74, suggesting the pair might enter overbought territory.
Resistance level: 142.05, 146.20
Support level: 137.55, 133.85
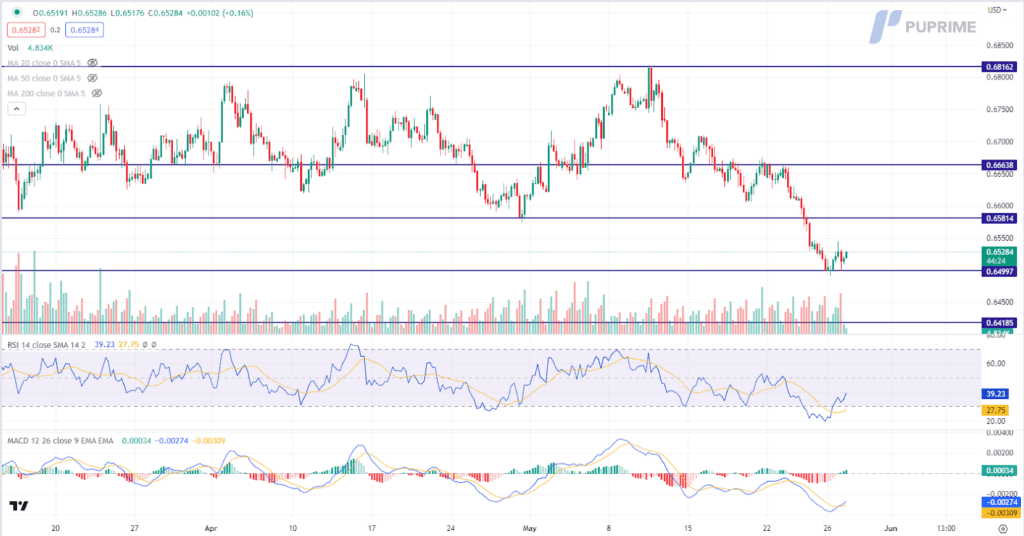
AUDUSD,H4
The Australian Dollar faced a significant decline as downbeat economic data from the region weighed heavily on the currency’s performance. The latest figures released by the Australian Bureau of Statistics revealed a disappointing contraction in Australia’s retail sales for the previous month. Retail sales figures stagnated at 0.00%, falling short of market expectations of a 0.30% increase. This underwhelming result underscores the challenges faced by the Australian economy as consumer spending failed to gain momentum.
AUD/USD is trading lower while currently testing the support level. However, MACD has illustrated increasing bullish momentum, while RSI is at 39, suggesting the pair might trade higher as technical correction since the RSI rebounded sharply from its oversold territory.
Resistance level: 0.6580, 0.6665
Support level: 0.6500, 0.6420
GBP/USD, H4
GBP/USD currency pair managed to stage a modest rebound, supported by positive economic data that fueled market demand for the Pound Sterling. The Official National Statistics reported that UK Retail Sales for the previous month increased, rising from a previous reading of -1.20% to 0.50%. This result surpassed market expectations of 0.40%, indicating a stronger-than-anticipated performance in the retail sector. However, despite this positive development, the appreciation of the US Dollar in response to upbeat inflation data and the growing optimism surrounding debt ceiling negotiations were limiting the pair’s bullish momentum.
GBPUSD is trading lower while currently testing the support level. MACD has illustrated diminishing bullish momentum, while RSI is at 43, suggesting the pair might extend its losses after successfully breakout since the RSI stays below the midline.
Resistance level: 1.2475, 1.2535
Support level: 1.2345, 1.2245
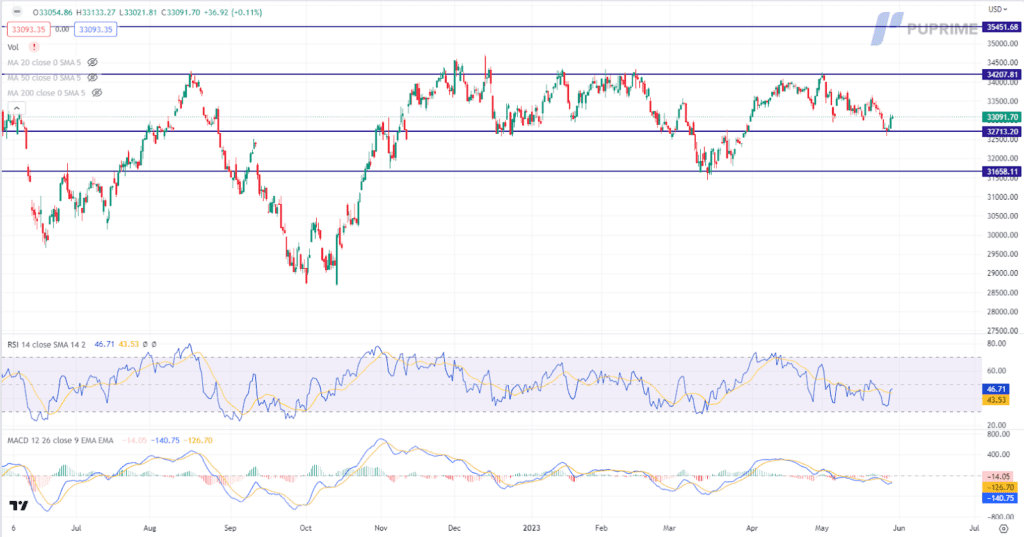
Dow Jones, H4
Risk-On sentiment continues to prompt the US equity market to experience a notable surge. Risky assets were boosted, while chip stocks experienced robust gains fueled by growing optimism surrounding artificial intelligence (AI). Nvidia Corp was a standout performer in this space, whose stock soared an impressive 24% to reach a record high last week. This remarkable surge was propelled by the chipmaker’s upbeat financial results, which reassured investors, and its announcement of ramping up supply to meet the surging demand for AI chips.
The Dow is trading higher following the prior rebound from the support level. MACD has illustrated diminishing bearish momentum, while RSI is at 47, suggesting the index might extend its gainsas the RSI rebound sharply from its oversold territory.
Resistance level: 34210, 35450
Support level: 32715, 31660
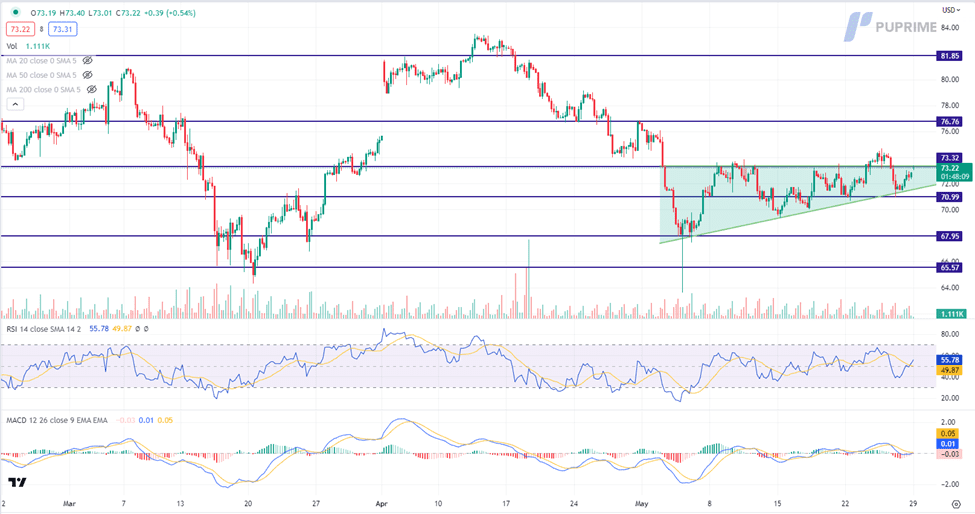
CL OIL, H4
Oil prices experienced an upward trend as US officials appeared to be on the brink of reaching a debt-ceiling deal. This development spurred market demand for risky assets, including the black commodity, as investors anticipated a resolution to the looming debt crisis. On the supply side, the number of US oil rigs declined by five to 570 on the supply side, according to Baker Hughes Co. It witnessed the most significant monthly drop in oil rigs since June 2020, with 21 rigs. This reduction in oil rigs further contributed to the positive sentiment surrounding oil prices, suggesting potential supply constraints in the market.
Crude oil prices are trading higher while currently testing the resistance level. MACD has illustrated diminishing bearish momentum, while RSI is at 56, suggesting the commodity might extend its gains after successfully breakout above the resistance level.
Resistance level: 73.30, 76.80
Support level: 71.00, 67.95
Start trading with an edge today
Trade forex, indices, Metais, and more at industry-low spreads and lightning-fast execution.
Start trading with deposits as low as $50 on our standard accounts.
Get access to 24/7 support.
Access hundreds of instruments, free educational tools, and some of the best promotions around.
Please note the Website is intended for individuals residing in jurisdictions where accessing the Website is permitted by law.
Please note that PU Prime and its affiliated entities are neither established nor operating in your home jurisdiction.
By clicking the "Acknowledge" button, you confirm that you are entering this website solely based on your initiative and not as a result of any specific marketing outreach. You wish to obtain information from this website which is provided on reverse solicitation in accordance with the laws of your home jurisdiction.
Ten en cuenta que el sitio web está destinado a personas que residen en jurisdicciones donde el acceso al sitio web está permitido por la ley.
Ten en cuenta que PU Prime y sus entidades afiliadas no están establecidas ni operan en tu jurisdicción de origen.
Al hacer clic en el botón "Aceptar", confirmas que estás ingresando a este sitio web por tu propia iniciativa y no como resultado de ningún esfuerzo de marketing específico. Deseas obtener información de este sitio web que se proporciona mediante solicitud inversa de acuerdo con las leyes de tu jurisdicción de origen.