US CPI released yesterday showed a two-year low inflation rate of 3%, leading to a decline in the US dollar.
Yesterday’s release of the U.S. Consumer Price Index (CPI) revealed that the country’s inflation had reached a two-year low of 3%, lower than the previous reading and the forecasted figure. As a result, the dollar’s value has declined, hitting its lowest level since last May and trading below $101. Meanwhile, the equity markets have received a boost from the positive economic data and are increasingly convinced that the Federal Reserve’s monetary tightening cycle is drawing to a close. The Japanese Yen has benefited the most against the softening dollar as investors are keen to hold this safe-haven currency in fear of recession. Additionally, the softer inflation data has provided an upward push to oil prices, with the West Texas Intermediate (WTI) crude oil trading above $75 per barrel.
Current rate hike bets on 26th July Fed interest rate decision:
Source: CME Fedwatch Tool
0 bps (5%) VS 25 bps (95%)
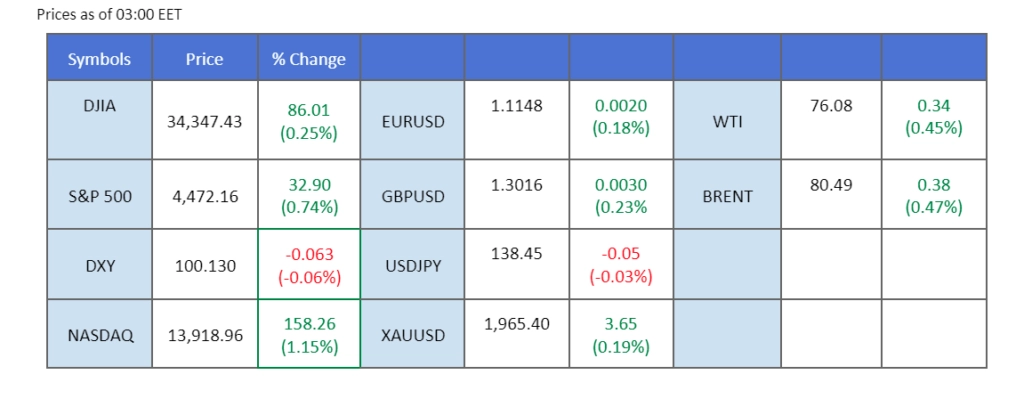
Market Overview
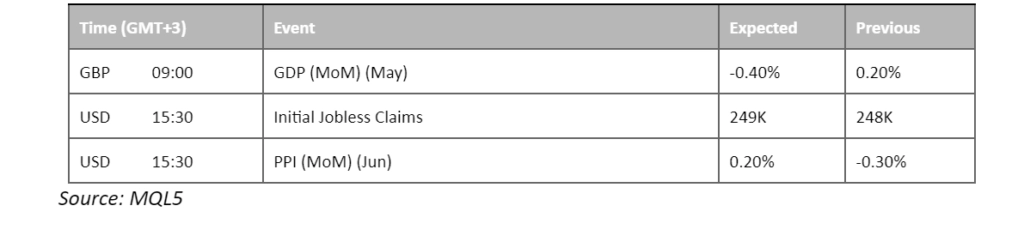
Economic Calendar
Market Movements
DOLLAR_INDX, H4
The US Dollar slumped over the backdrop of downbeat inflation reports. the Consumer Price Index showing a rise of just 3% compared to the previous year, the lowest level in over two years. The moderation in inflationary pressures provides the Federal Reserve with an opportunity to recalibrate its monetary policy stance, potentially slowing down its tightening measures. While traders have priced in a strong possibility of a 25-basis points rate hike in the upcoming Federal Reserve meeting in late July, a more dovish stance is being anticipated in the longer term. This sentiment is driven by a series of downbeat economic data, including disappointing job reports and inflation readings, as well as dovish statements from several Federal Reserve members.
The dollar index is trading lower while currently near the support level. However, MACD has illustrated diminishing bearish momentum, while RSI is at 19, suggesting the index might enter oversold territory.
Resistance level: 101.05, 101.95
Support level: 100.25, 99.25
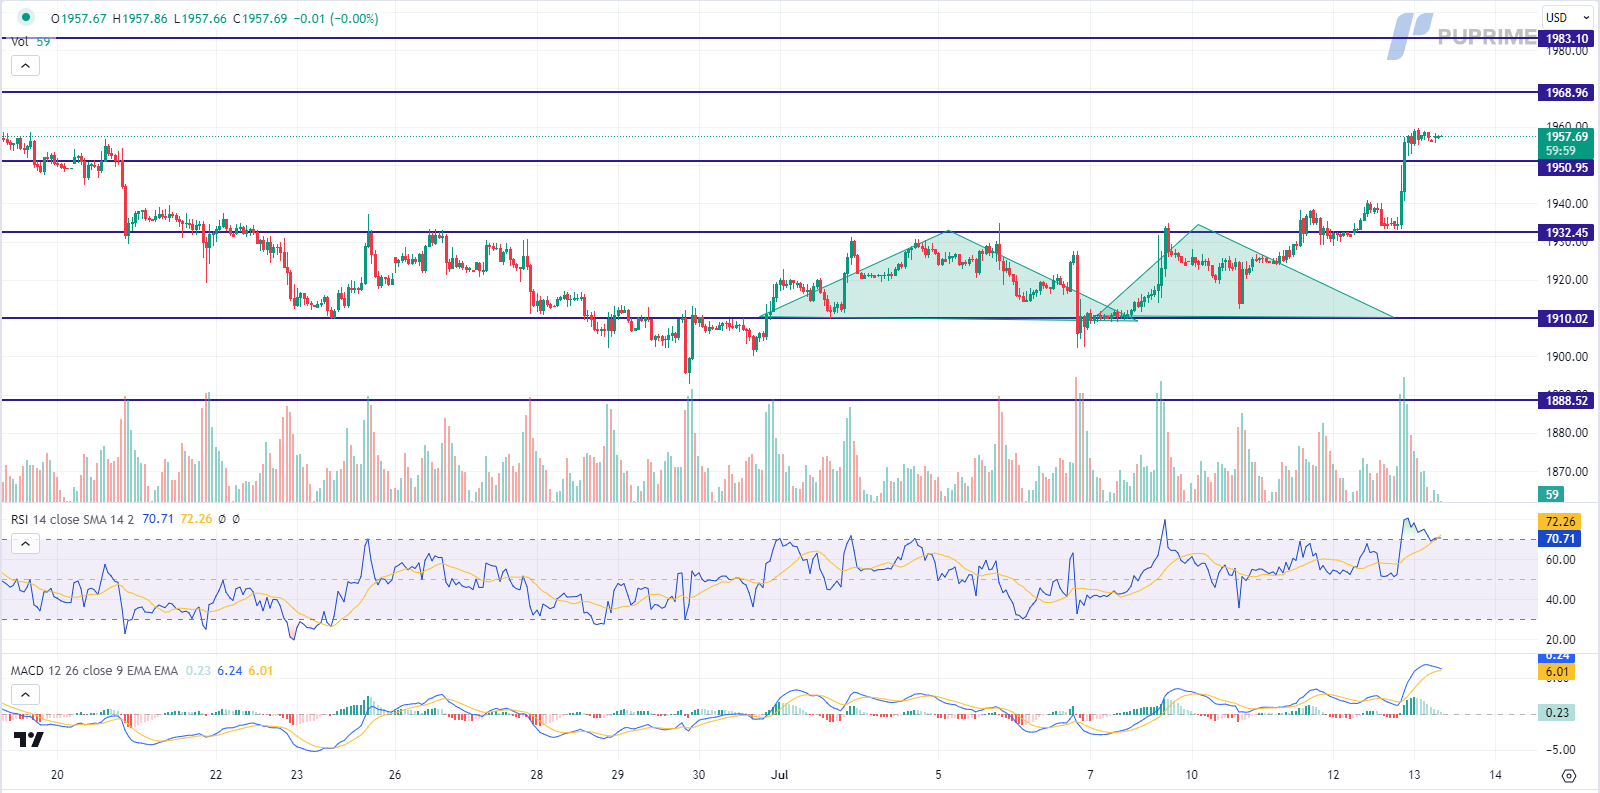
XAU/USD, H4
The recent decline in inflation to its lowest level in over two years has raised expectations of a potential adjustment in the Federal Reserve’s monetary policy. While short-term rate hike expectations persist, market participants are increasingly pricing in a more dovish stance in the long run. The market’s reaction, characterised by a selloff in the US Dollar, sparked bullish momentum on the dollar-denominated gold.
Gold prices are trading higher following the prior breakout above the resistance level. However, MACD has illustrated diminishing bullish momentum, while RSI is at 71, suggesting the commodity might enter overbought territory.
Resistance level: 1970.00, 1985.00
Support level: 1950.00, 1930.00
EUR/USD,H4
The dollar index has plunged by nearly 2% since Monday and the CPI data released yesterday worsened the situation. The U.S. CPI came at the lowest in 2 years at 3%; this reading is lower than the market expectation hence, hammered the dollar to trade lower, believing that the Fed is ending its monetary tightening cycle. By taking advantage of the weakening dollar, the pair has traded to its highest level since last March. Investors will wait for the Eurozone CPI and observe if it will be a catalyst for the pair to trade higher.
EUR/USD traded strongly and has traded to its highest level since last March in the backdrop of softer U.S. inflation. The RSI showed the pair is overbought and the MACD continued to gain, indicating the bullish momentum is strong with the pair.
Resistance level: 1.1157, 1.1237
Support level: 1.1088, 1.1027
GBP/USD,H4
The Cable broke above its psychological resistance level at 1.3000 with the boost of the softer U.S. CPI reading. The Sterling continues to trade strongly and has reached its highest level since last April. The U.S. CPI reading prompted the market to believe the Fed’s tightening cycle is ending soon and weakening the dollar’s strength. In contrast, the UK’s inflation rate has remained at a high level and is expected that the BoE will continue to raise interest rates to put the inflation rate under control.
The Cable is trading on a bullish momentum and is now trading above its psychological level at 1.3000. The RSI has broken into the overbought zone while the MACD continues to surge; both indicators depict a bullish signal for the Cable.
Resistance level: 1.3015, 1.3095
Support level: 1.2910, 1.2840
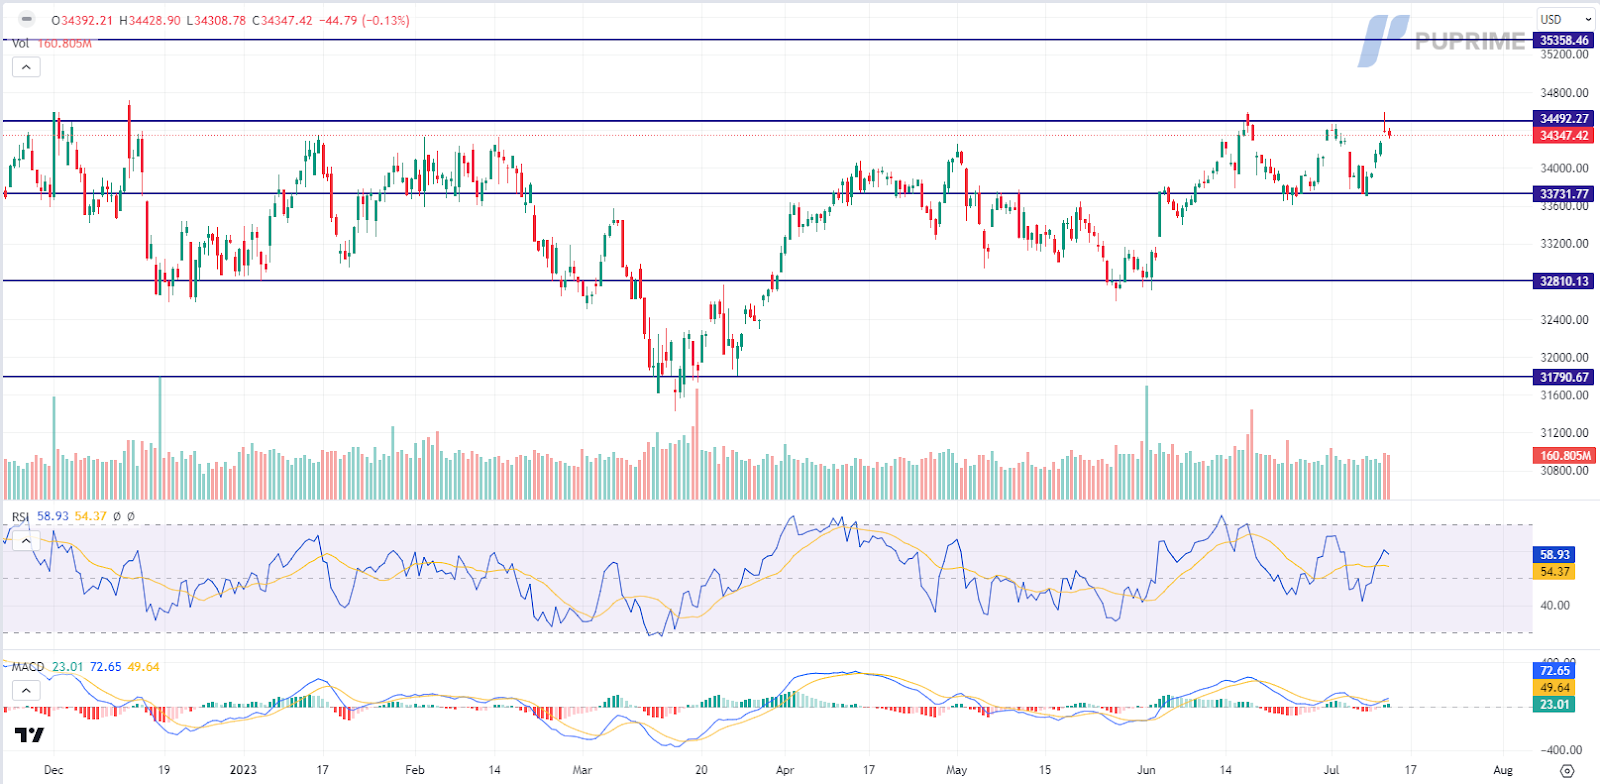
Dow Jones, H4
The US equity market surged after the inflation reports indicated easing signs. In a resounding response to the release of disappointing inflation data, US Treasury yields plummeted even further, intensifying concerns, and prompting investors to reassess the likelihood of impending rate hikes by the Federal Reserve. Simultaneously, the US Dollar experienced significant selling pressures, while the US equity market staged a robust rebound.
The Dow is trading higher while currently testing the resistance level. MACD has illustrated increasing bullish momentum, while RSI is at 59, suggesting the pair might extend its gains after successfully breakout above the resistance level.
Resistance level: 34490.00, 35360.00
Support level: 33730.00, 32810.00
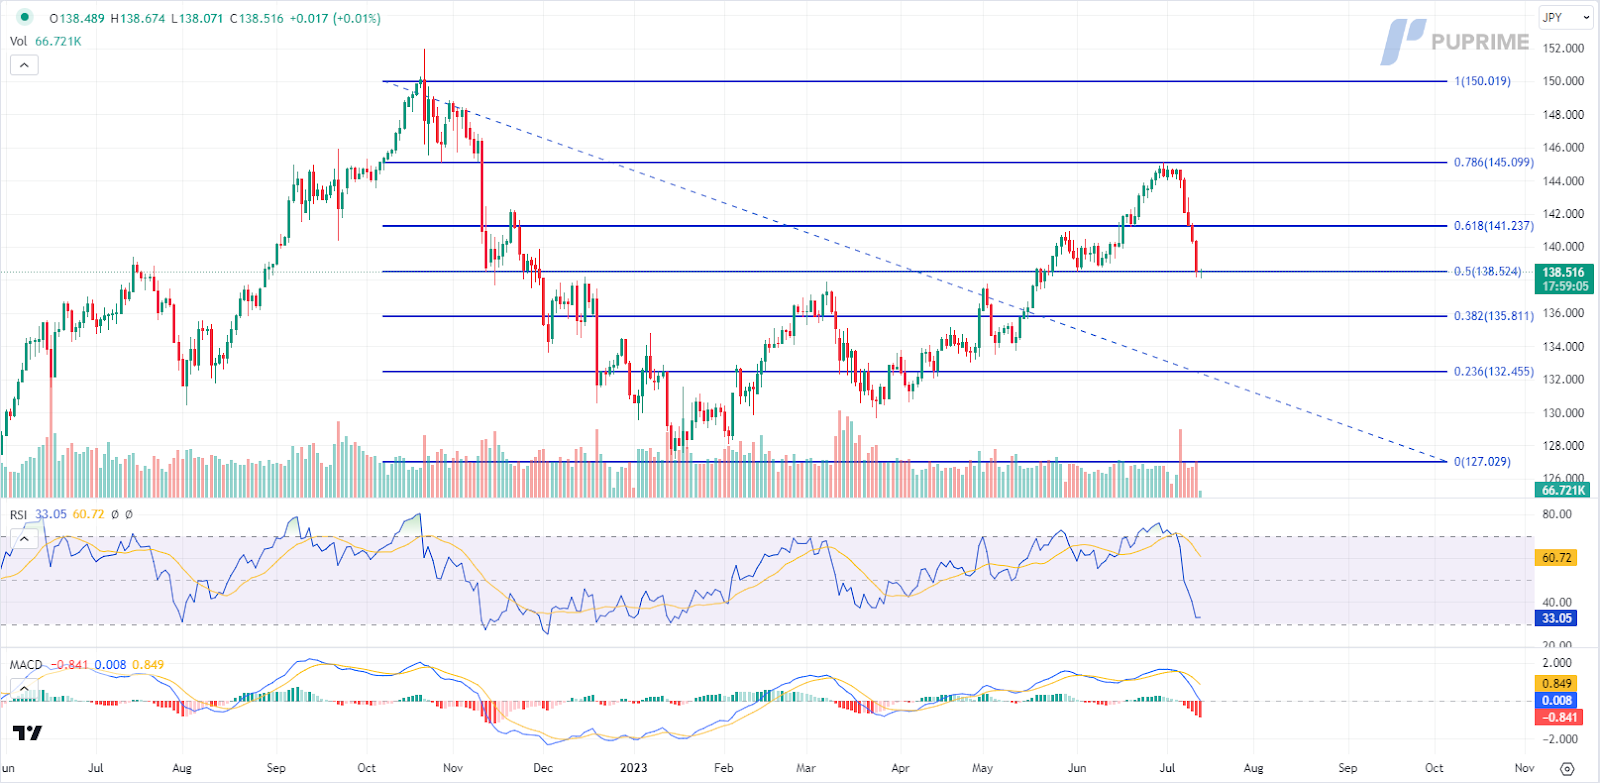
USD/JPY, H4
The USD/JPY pair remains entrenched in a persistent downtrend as investor sentiment continues to be marred by lacklustre US inflation figures, prompting the yield differential between the United States and Japan to contract. With the eagerly anticipated July monetary meeting of the Federal Reserve on the horizon, market participants widely anticipate a 25 basis points hike; however, the prevailing sentiment suggests that the prospects for an end to the tightening monetary policy in the long run are increasingly probable.
USD/JPY is trading lower while currently testing the support level. MACD has illustrated increasing bearish momentum, while RSI is at 33, suggesting the pair might extend its losses after breakout since the RSI stays below the midline.
Resistance level: 141.25, 145.10
Support level: 138.50, 135.80
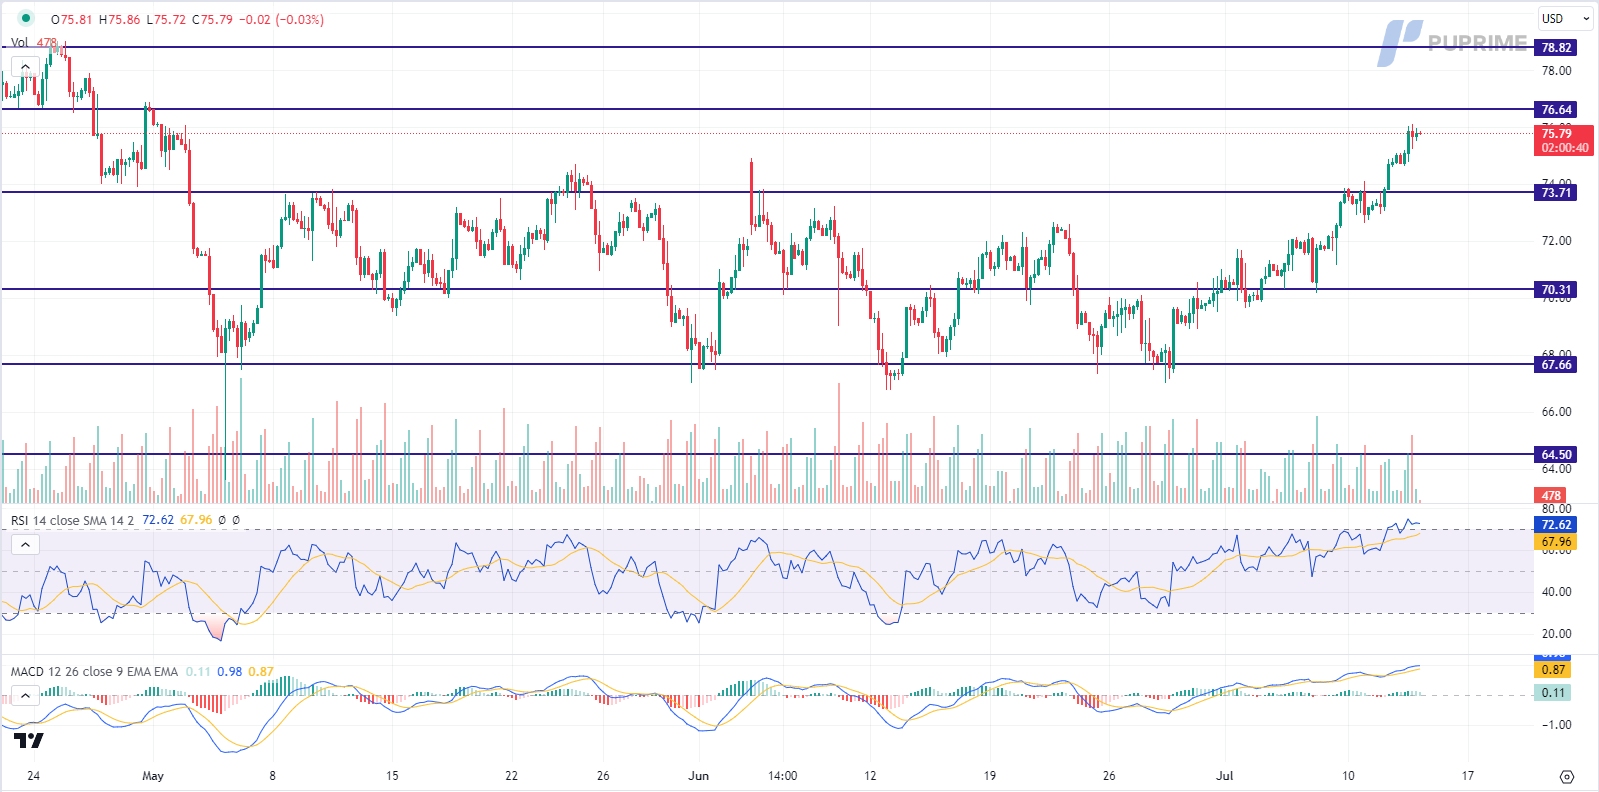
CL OIL, H4
Following the release of a dovish US inflation report, oil prices witnessed a substantial surge, bolstered by the aggressive slump in the US Dollar. The prospect of a more accommodative stance from the central bank has fueled optimism regarding future oil demand. In addition, the International Energy Agency (IEA) anticipates a tight oil market throughout the second half of 2023, attributing it to robust demand from China and developing countries, coupled with supply cuts implemented by leading oil producers. The strong demand dynamics from key global economies have played a pivotal role in supporting oil prices amidst geopolitical uncertainties and market volatility.
Oil prices are trading higher following the prior breakout above the previous resistance level. However, MACD has illustrated diminishing bullish momentum, while RSI is at 73, suggesting the commodity might enter overbought territory.
Resistance level: 76.65, 78.80
Support level: 73.70, 70.30
Start trading with an edge today
Trade forex, indices, Metais, and more at industry-low spreads and lightning-fast execution.
Start trading with deposits as low as $50 on our standard accounts.
Get access to 24/7 support.
Access hundreds of instruments, free educational tools, and some of the best promotions around.
Please note the Website is intended for individuals residing in jurisdictions where accessing the Website is permitted by law.
Please note that PU Prime and its affiliated entities are neither established nor operating in your home jurisdiction.
By clicking the "Acknowledge" button, you confirm that you are entering this website solely based on your initiative and not as a result of any specific marketing outreach. You wish to obtain information from this website which is provided on reverse solicitation in accordance with the laws of your home jurisdiction.
Ten en cuenta que el sitio web está destinado a personas que residen en jurisdicciones donde el acceso al sitio web está permitido por la ley.
Ten en cuenta que PU Prime y sus entidades afiliadas no están establecidas ni operan en tu jurisdicción de origen.
Al hacer clic en el botón "Aceptar", confirmas que estás ingresando a este sitio web por tu propia iniciativa y no como resultado de ningún esfuerzo de marketing específico. Deseas obtener información de este sitio web que se proporciona mediante solicitud inversa de acuerdo con las leyes de tu jurisdicción de origen.