Baixe o App
-
- Plataformas de Trading
- PU Prime App
- MetaTrader 5
- MetaTrader 4
- PU Copy Trading
- Trader Web
- PU Social
-
- Condições de Trading
- Tipos de Conta
- Spreads, Custos & Swaps
- Depósitos & Retiradas
- Taxas & Encargos
- Horários de Trading

Baixe o App

The dollar index exhibited a narrow range of movement following the much-anticipated release of the FOMC meeting minutes yesterday.
The dollar index exhibited a narrow range of movement following the much-anticipated release of the FOMC meeting minutes yesterday. As anticipated, board members expressed concerns about the potential risks of cutting rates too quickly, emphasising the preference to maintain elevated interest rates for an extended period to avoid harming the economy. Despite the consensus that interest rates are likely at their peak, the timing of the first rate cut remains unclear.
In the commodities market, Israel intensified its strikes on Gaza after the previous ceasefire talks ended unfavourably. This development stimulated oil prices, leading to a gain of more than 1% in the last session. Meanwhile, gold prices maintained their position above the $2020 trajectory.
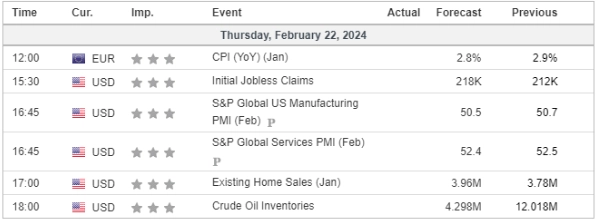
Additionally, traders are closely monitoring economic data from the eurozone, including PMI readings and the Consumer Price Index (CPI), to assess the strength of the euro. The interplay of global geopolitical events, central bank communications, and economic indicators continues to shape market dynamics across various asset classes.
Current rate hike bets on 20th March Fed interest rate decision:
Source: CME Fedwatch Tool
0 bps (89.5%) VS -25 bps (10.5%)

(MT4 System Time)

Source: MQL5

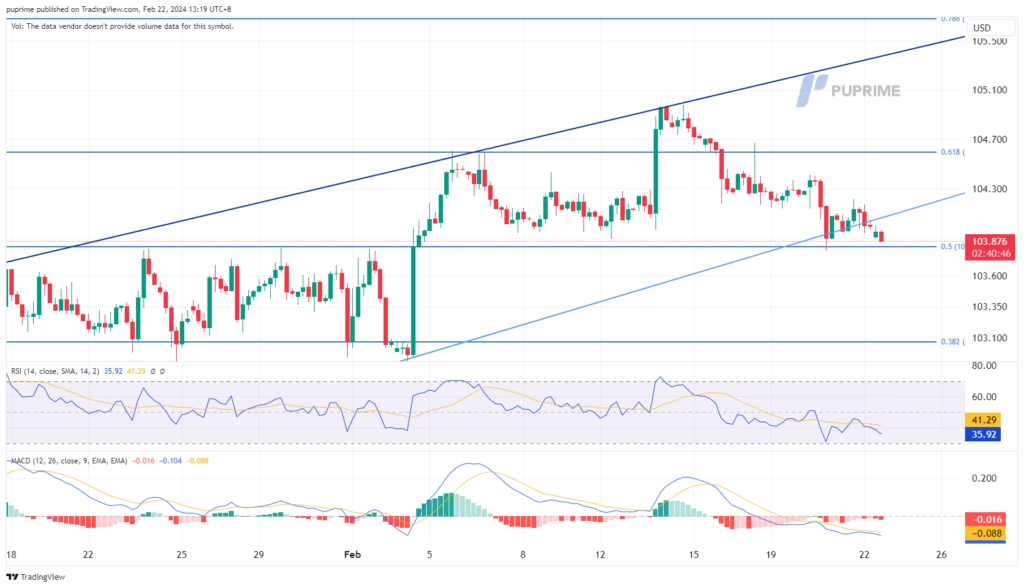
The US Dollar maintains a neutral stance as the FOMC meeting minutes unveil a nuanced outlook, with Federal Reserve officials expressing both optimism and caution on inflation. The minutes reveal a sense of accomplishment in curbing inflation but underscore the need for a careful assessment of economic data before any rate-cutting decisions. The focus pivots back to US economic performance as the central bank remains deliberate in its approach.
The Dollar Index is trading lower while currently testing the support level. However, MACD has illustrated diminishing bearish momentum, while RSI is at 40, suggesting the index might experience technical correction since the RSI rebounded sharply from oversold territory.
Resistance level: 104.60, 105.70
Support level: 103.85, 103.05
Following the Federal Reserve’s reluctance to expedite interest rate cuts, gold prices experienced a tumble but resiliently held above the key support level of $2025. The risk-off sentiment prevails in the market as uncertainties persist in Middle East tensions, bolstering the safe-haven appeal of gold amidst a shifting economic landscape.
Gold prices are trading lower following the prior retracement from the resistance level. MACD has illustrated increasing bearish momentum, while RSI is at 58, suggesting the commodity might extend its losses since the RSI retreated sharply from overbought territory.
Resistance level: 2035.00, 2060.00
Support level: 2015.00, 1985.00
The Pound Sterling exhibited strength against the U.S. dollar, and the recently released FOMC meeting minutes did not act as a catalyst for the dollar. While the board members acknowledged that the interest rate in the U.S. is likely at its peak, they refrained from specifying the exact timing for the first rate cut. This ambiguity left the strength of the dollar largely unchanged, and market participants are closely monitoring developments for further insights into the potential trajectory of U.S. monetary policy.
GBP/USD remains at the peak of its price consolidation range and is testing the resistance level at 1.2634. The RSI is gradually moving upward while the MACD continues to rise after breaking above the zero line, suggesting bullish momentum is forming.
Resistance level: 1.2710, 1.2785
Support level:1.2530, 1.2440
The EUR/USD pair has broken above its downtrend resistance level, indicating a potential trend reversal for the pair. Despite the release of the FOMC meeting minutes, which did not boost the dollar’s strength, the euro continued its bullish run, benefiting from the lacklustre performance of the dollar. Traders are now focusing on key economic indicators, including the euro’s Consumer Price Index (CPI) and Purchasing Managers’ Index (PMI) readings scheduled for later today.
EUR/USD rebounded from its recent low and has broken above its long-term resistance level, suggesting a potential trend reversal for the pair. The RSI remains at elevated levels while the MACD continues to move upward, suggesting the bullish momentum remains strong.
Resistance level: 1.0865, 1.0954
Support level: 1.0775, 1.0770
The Dow Jones edges higher as investors engage in dip-buying following the release of the Federal Reserve’s January meeting minutes. Policymakers’ signals of no urgency in pivoting towards rate cuts coincide with concerns over inflation risks. US Treasury yields maintain near session highs, underscoring market confidence in the equity market, propelled by stronger-than-expected corporate results. Energy stocks lead the broader market higher, supported by sustained oil prices amid heightened geopolitical tensions in the Middle East.
Dow Jones is trading higher following the prior rebound from the support level. MACD has illustrated diminishing bearish momentum, while RSI is at 54, suggesting the index might extend its gains toward resistance level since the RSI stays above the midline.
Resistance level: 39420.00, 41325.00
Support level: 37925.00, 36745.00
The Australian dollar maintains its positive trajectory against the lacklustre U.S. dollar. Recent economic indicators from Australia are contributing to the currency’s strength. The wage price index released yesterday revealed that the country is experiencing its highest annual wage growth in 15 years. Additionally, the latest Service Purchasing Managers’ Index (PMI) reading came in higher than the previous figure, suggesting that the economic performance in Australia remains robust. This favourable economic backdrop may prompt the Reserve Bank of Australia (RBA) to adhere to its monetary tightening policy, further buoying the strength of the Australian dollar.
The AUD/USD pair has found support above its resistance level at 0.6535. The RSI remains at the elevated levels while the MACD moving flat above the zero line suggests the bullish momentum is intact with the pair.
Resistance level: 0.6210, 0.6260
Support level: 0.6145, 0.6080
Despite the recent lacklustre performance of the U.S. dollar, the Japanese Yen has struggled to regain ground against it. Last week, Japan’s GDP came in below expectations, coupled with a gradual easing of the inflation rate. These factors suggest that the Bank of Japan (BoJ) may need to wait for additional data before considering a shift from its ultra-loose monetary policy. This stance is putting pressure on the strength of the Yen. Traders are now looking ahead to the upcoming release of Japan’s Consumer Price Index (CPI) next Tuesday, as it is expected to provide further insights into the potential direction of the USD/JPY pair.
The USD/JPY pair has found support and traded firmly at a level above 149.90. The RSI is approaching the overbought zone while the MACD has declined to near the zero line, suggesting the bullish momentum is lacking.
Resistance level: 151.85, 154.80
Support level:149.50, 147.60
Crude oil prices extend gains, fueled by signs of tightening supplies amid rising geopolitical tensions in the Middle East. Ongoing concerns over Houthi attacks on commercial vessels in the Red Sea contribute to a reassessment of near-term supply tightness. However, gains are tempered by a bearish API inventory report revealing a higher-than-expected increase in US crude inventories. Eyes remain on the forthcoming EIA oil inventory report for further market signals.
Oil prices are trading higher while currently testing the resistance level. MACD has illustrated diminishing bearish momentum, while RSI is at 57, suggesting the commodity might extend its gains after breakout since the RSI stays above the midline.
Resistance level: 78.65, 81.20
Support level: 75.20, 71.35

Trade forex, indices, Metais, and more at industry-low spreads and lightning-fast execution.
Registe-se para uma Conta PU Prime Real com o nosso processo sem complicações
Financie sem esforço a sua conta com uma vasta gama de canais e moedas aceites
Aceda a centenas de instrumentos em condições de negociação líderes de mercado
Please note the Website is intended for individuals residing in jurisdictions where accessing the Website is permitted by law.
Please note that PU Prime and its affiliated entities are neither established nor operating in your home jurisdiction.
By clicking the "Acknowledge" button, you confirm that you are entering this website solely based on your initiative and not as a result of any specific marketing outreach. You wish to obtain information from this website which is provided on reverse solicitation in accordance with the laws of your home jurisdiction.
Thank You for Your Acknowledgement!
Ten en cuenta que el sitio web está destinado a personas que residen en jurisdicciones donde el acceso al sitio web está permitido por la ley.
Ten en cuenta que PU Prime y sus entidades afiliadas no están establecidas ni operan en tu jurisdicción de origen.
Al hacer clic en el botón "Aceptar", confirmas que estás ingresando a este sitio web por tu propia iniciativa y no como resultado de ningún esfuerzo de marketing específico. Deseas obtener información de este sitio web que se proporciona mediante solicitud inversa de acuerdo con las leyes de tu jurisdicción de origen.
Thank You for Your Acknowledgement!